Introduction to Climpact: Generating Climate Indices to Support Climate Services
Section outline
-
Course Description
How to Take This Course
Welcome to the course, Introduction to Climpact: Generating Climate Indices to Support Climate Services.
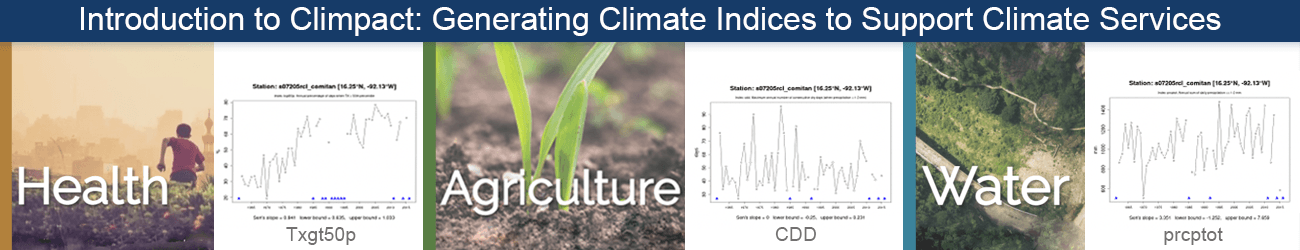
This course explores how to generate sector-specific climate information relevant for climate-sensitive sectors through the use of an open-source software package called Climpact. Approximate time to complete: 3 to 3.5 hours.
For full course description click "Course Description" above.
IMPORTANT: Please note, in order to receive a badge of completion for this course, you must be enrolled and logged in to your account on this site. Please read the instructions in "How to Take This Course" before you get started. You may also consult this course as a guest, but in this case, no badge of completion is provided.
-
-
-
Module 1 Quiz
-
-
-
-
Module 2 Quiz
-
-
-
-
Module 3 Quiz
-
-
-
-
Module 4 Quiz
-
-
-
-
Module 5 Quiz
-
-
-
-
Module 6 Quiz
-
-
-
-
Module 7 Quiz
-
-
-
-
Module 8 Quiz
-
-
-
-